Articles
National, state and district-level estimates of stillbirth in India at 20 weeks' gestation or longer using national family health survey data (2005–21)
Anuj Kumar Pandey,a Dyah Anantalia Widyastari,a,* Bhudatta Samalucksh,b Sweetyar Panigrahy,b and Sutapa Bandyopadhyay Neogib
aInstitute for Population and Social Research, Mahidol University, Salaya, Phutthamonthon, Nakhon Pathom, 73170, Thailand
bDepartment of Health System and Implementation Research, International Institute of Health Management Research - Dwarka, New Delhi, India
Summary
Background India contributes a substantial share to the global stillbirth burden. However, stillbirths occurring before 28 weeks of gestation are not captured in routine surveys, contributing to systematic underestimation and missed opportunities for targeted interventions. This study estimated stillbirth burden at different gestational age cut-offs at the national, state and district levels to fill this data gap.

Methods This study used three rounds of National Family Health Survey (NFHS) data (2005–06, 2015–16 and 2019–21) to capture over a million pregnancies and births. We calculated the stillbirth rate (SBR) at more than equal to 28, 24 and 20 weeks of gestation using retrospective reproductive calendar data. We defined stillbirths based on reported duration of pregnancy (in months) ending in fetal death, excluding miscarriages and abortions. We leveraged multivariable analysis and propensity score matching methods for risk factor assessment for stillbirths at more than equal to 28-week gestation.

Findings Analysis of 542,359 women from three survey rounds showed SBR of 12.8 (95% CI 10.7, 15.2), 16.2 (95% CI 13.6, 18.8), and 22.0 (95% CI 19.4, 24.7) per 1000 total births at more than equal to 28, 24, and 20 weeks of gestation, respectively. A total decline of 18% in SBR was noted between 2005 and 2015-16, and only 4% of districts achieved single-digit SBR during 2019-21. During 2019-21, an estimated 42% of stillbirths were reported between more than equal to 20 and less than equal to 28 weeks gestation. District-wise spatial analysis indicated moderate clustering (crude vs smoothed global Moran's I: 0.134 vs 0.168 in 2019-21). Stillbirth was associated with illiteracy, short maternal stature, anaemia, use of unclean cooking fuel, rural residence, and belonging to scheduled caste category. Lower risks were observed among women wanting delayed pregnancies and residing in joint families.

Interpretation Stillbirth remains a key public health concern in India. Counting only late-gestation stillbirths could mask the true burden, missing opportunities for targeted intervention. The study recommends standardizing data systems till district level with accurate gestational age reporting that must be made more accessible for evidence-based decision-making.

Funding None.

Copyright © 2024 The Author(s). Published by Elsevier Ltd. This is an open access article under the CC BY-NC-ND license (http://creativecommons.org/licenses/by-nc-nd/4.0/).

Keywords: Stillbirth; SBR; SDG; Gestational age; Risk factors
The Lancet Regional
Health - Southeast
Asia
2024;10: 100757
Published Online 31 March 2024
https://doi.org/10.1016/j.lansea.2024.100757
Introduction

Stillbirth, which is often defined as the birth of a fetus with no signs of life, is a critical public health concern. The World Health Organization (WHO) uses a pragmatic definition for international reporting of stillbirths, which is a foetal death at more than equal to 28 completed weeks' of gestation or birthweight more than equal to 1000 g if gestational age is unknown. Global estimate of burden is 1.9–2.0 million stillbirths per year using the WHO definition (more than equal to 28 weeks' gestation), translating to roughly one stillbirth every 16 seconds.1,2 Majority of the global stillbirth burden occurs in LMICs, concentrated in sub-Saharan Africa and South Asia. Progress in reducing stillbirth rates has consistently lagged behind reductions in neonatal and maternal mortality, although attention and SDG targets have improved.3

Articles
Research in context
Evidence before this study

Literature review using PubMed, WHO/UNICEF website, and Google Scholar with terms "stillbirth", "India", "gestational age", "data quality" and "risk factors" yielded studies reporting inconsistencies in definitions and estimates of stillbirth. The WHO defines stillbirth as foetal deaths at or after 28 weeks (or more than equal to 1000 g), while many high-income countries use 20-22 weeks, leading to underestimation in low- and middle-income countries (LMICs). India accounts for about 17.3% of global stillbirths, yet national data vary widely: 24.7 (more than equal to 28 weeks), 20 (more than equal to 28 weeks), and 17.4 (more than equal to 28 weeks) per 1000 births in 2021 as per GBD estimates, India's Civil Registration System (CRS) 2020 report, and Health Management Information System (HMIS) estimates. Estimates that map at equal to 28 weeks estimated in a recent article suggest that Sample Registration System (SRS) estimates are substantially lower than those from NFHS (except for 2019-21) due to differences in reporting, variable gestational age cut-offs, and misclassification between stillbirth and early neonatal death. Few studies assess stillbirths below 28 weeks, where preventable limits persist, and examine social and medical determinants driving inequities.

Added value of this study

This study provides a comprehensive assessment of stillbirths in India across (more than equal to 20 week) sixth (more than equal to 24 week), and (more than equal to 28 week) seventh months of gestation using data from Nationally representative sample survey from 2005-06 to 2019-21. It provides estimates of SBR at national, state/union territory (UT) and district level in India. In addition, it provides insights into the states and districts that have achieved the targets set under India Newborn Action Plan (INAP) and Every Newborn Action Plan (ENAP). By analysing stillbirths below the conventional more than equal to 28-week threshold, it captures losses often missed in national estimates at national, state/UT and district level. Unlike previous models based on aggregated or modelled data, this population-based analysis quantifies disparities and presents district level burden. It also explores how maternal and household characteristics and socio-economic conditions interact to influence stillbirth risk.

Implications of all the available evidence

The study highlights that stillbirth remains a public health concern in India, with notable spatial disparities. Despite some progress, the persistently high stillbirth rates, particularly at earlier gestational ages underscore the need for strengthened maternal and newborn care. District-level clustering suggests concentrated areas of vulnerability requiring targeted interventions. Addressing preventable risk factors through comprehensive maternal and newborn care strategies is also critical for reducing the burden.

Many high-income country registries and public health statistics record foetal deaths from 20 weeks' gestation (or 350–500 g birthweight) and above, which produces a larger count of foetal deaths and different rate denominators. The International Classification of Diseases (ICD) and UN guidelines have therefore proposed to improve harmonisation where gestational age information is missing. Differences like these in 20, 22, or 28 weeks create a major source of divergence between data sources and complicate international and within-country comparisons.4

Clinically and legally, many systems treat pregnancy losses before 20 weeks as miscarriage/abortion, and those at or after 28 weeks as stillbirth. But losses occurring between 20 and 28 weeks are largely uncharacterised. That middle window includes many foetuses that may be viable with better antenatal care, timely detection and timely interventions, particularly when intensive neonatal support is available. In LMICs, much of this mid-pregnancy loss goes unrecorded and unmeasured. Furthermore, misclassification of early neonatal deaths as stillbirths and vice versa occurs in settings with limited capacity to assess signs of life at birth.5

Stillbirths have multi-factorial aetiologies, including maternal, foetal, placental, and environmental factors. Infections, hypertensive disorders of pregnancy, and foetal growth restriction are common causes. Socio-economic determinants, such as maternal age, education, wealth, and access to quality healthcare, play a significant role. Modifiable risk factors like maternal obesity, tobacco use, and short interpregnancy intervals have also been identified. In India, factors such as poor maternal nutrition, inadequate antenatal care, and home deliveries without skilled birth attendants contribute to the high stillbirth burden.6

IGME)Every newborn estimate, Lancet modelling) often yield higher numbers. Some reasons include inconsistent definitions of gestational-age cutoffs, misclassification of early neonatal deaths as stillbirths (or vice-versa), incomplete capture of foetal deaths in facility deaths, and survey questionnaire limitations that group miscarriages/abortions/stillbirths or do not reliably capture gestational age.7,8 However, in the absence of complete civil registration and vital statistics (CRVS) in India, National Family Health Survey (NFHS) stands out as it is the only available nationally representative sample survey that also systematically captures pregnancy outcomes, including stillbirths, along with information on pregnancy duration reported by women, enabling gestational-age-specific classification at the population level. Additionally, the standardized electronic data collection process further enhances its usability when compared to other sources.9

In this study we aim to estimate stillbirths at different gestational time points, specifically during the sixth (more than equal to 20 weeks), seventh (more than equal to 24 weeks), and eighth (more than equal to 28 weeks) months of pregnancy using data from the NFHS. By disaggregating stillbirths across these gestational periods, we aim to capture the burden that may be missed by conventional cut-offs. Additionally, the study assesses the contextual maternal, socio-demographic, and health-system risk factors contributing to stillbirths in India, thereby providing evidence to inform targeted prevention strategies and improve perinatal outcomes.

Methods
Study design and data source

The study used multiple rounds of nationally representative sample survey data in India, known as National Family Health Survey (NFHS: year 2005–06, 2015–16 and 2019–21) for the trend analysis whereas the study leveraged recent round i.e., 2019–21 for risk factor assessments. NFHS is a large-scale, multi-round survey conducted on representative samples from all states and union territories in India. It included a total of 724,115 (approximately 97% response rate), 699,686 (approximately 97% response rate) and 124,385 (approximately 95% response rate) women aged 15–49 years during 2019–21, 2015–16 and 2005–06 respectively.10 This data was obtained from the DHS data program portal following prior registration and permission. The dataset is publicly available and contains no identifiable information.11

All women, irrespective of marital status, who had any history of birth or termination in past five years preceding the survey were considered for the burden analysis whereas recent births were considered for risk factor assessments. Those outcomes that were classified as stillbirth following the definition used as presented in Appendix Table S1. A total of 231,519, 252,973, and 57,867 total births at more than equal to 20 weeks of gestation (including live births and stillbirths) were considered for the burden assessment in the periods 2019–21, 2015–16, and 2005–06, respectively (this sample was re-stratified to get sample for more than equal to 24 and more than equal to 28 weeks of gestation). The risk factor assessment, a total of 176,215 recent total births having stillbirth at more than equal to 20-week gestation was included as pregnancy care related information was available only for recent total births in the NFHS.

Selection of variables in NFHS

Based on extensive literature review and availability of data elements in NFHS, this study broadly guided by a conceptual framework-Commission on Social Determinants of Health (CSDH).12 The application of the CSDH framework have been broadly discussed and elaborated in a systematic review13 which highlights that health and mortality are influenced by structural factors like governance, macroeconomic policies, public policies, culture and societal values; as well as intermediary factors like material circumstances, psychosocial factors, behavioral/biological factors, and health systems. We adopted this framework and classified factors into three domains: individual (including healthcare), household, and community related factors that could broadly determine stillbirth. These variables were categorized as modifiable if existing literature/guidelines suggest that target interventions could alter the overall effect on outcome.14 For NFHS data, those modifiable risk factors and which emerged significant in final model of adjusted regression analyses were considered for further assessment. Appendix Table S2 elucidates all the risk factors.

The burden of stillbirth is calculated at three gestational age cut-offs: more than equal to 20 weeks, more than equal to 24 weeks, and more than equal to 28 weeks of gestation whereas risk factor assessment was done for more than equal to 20 weeks gestation. Although NFHS provides information on stillbirth in 2015 and 2019 variables, yet these two variable classifications were not used, considering the suboptimal quality (Appendix Table S3). Hence we have used vcal (reproductive calendar) variable from NFHS, which provides information from all sampled women about history of birth (B), termination (T), pregnancy (P) and contraceptive usage (0), for what is assigned for each month in the calendar period. Pregnancy following termination (which included all miscarriage, abortion and stillbirth) were reclassified to estimate the gestational age at the time of the outcome. Specifically, pregnancies ending as termination at more than equal to 20 weeks correspond to approximately 5 months of pregnancy, more than equal to 24 weeks correspond to approximately 6 months, and more than equal to 28 weeks correspond to 7 months stillbirths. Although late-trimester abortions/miscarriages represent smaller fraction, some degree of misclassification between foetal deaths and pregnancy terminations may have resulted in minimal residual misclassification bias. In
Articles

response to these, sensitivity analysis is done to assess the robustness of the estimations made to alternate stillbirth definition by applying alternative gestational age thresholds using continuous variable (more than equal to 6, more than equal to 7, and more than equal to 8 months). Additionally, a rounding-adjusted specification was implemented by extending to ±1-month gestations to evaluate the impact of rounding and heaping. The proportion of stillbirths reclassified under each scenario was comparable to the primary definition. The complex sampling design was adjusted during all analysis for setting the primary sampling unit and stratification variable using the svyset command in Stata.

Further, quality assessment included judging availability of missing data. Missing values ranged between 1 and 7% for variables such as caste (4.9%), number of antenatal checkups (ANC) (6.7%), timing of ANC (3.3%), height of women (2.5%), anaemia status (3.7%), cooking fuel (1.1%), drinking water (1.0%), floor material (4.8%), and type of toilet facility (5.0%). Considering these as critical variables, multiple imputation techniques were adopted to impute the missing data using non-missing background characteristics namely place of residence, wealth status and education.15

Statistical analysis

This analysis was done at national, state and district level. Geographical representation is state/district was graphically presented using QGIS version 3.44.3 software. District level assessment was not done for 2005–06 as no data were available whereas for 2015–16 and 2019–21 a total of 707 and 640 districts were assessed. To ensure comparability, district identifiers from earlier NFHS rounds were meticulously harmonised with the most recent Government of India district boundary framework. A limited reassessment is attached as Appendix Table S4 to enhance transparency and reproducibility. Further clustering in district level SBR was validated by using Moran's I, which is a commonly used measure of spatial autocorrelation. GeoDa software16 was used to calculate Local Moran's I, which provides insights on the spatial clustering of areas. This method evaluates whether districts with comparable or contrasting levels of SBR prevalence are spatially grouped. Essentially, Moran's I calculate the degree of association between the prevalence in one district and that of its neighbouring districts, thereby quantifying the extent of spatial clustering or dispersion. Local Indicators of Spatial Association (LISA) were utilized to pinpoint the exact locations of these clusters and detect spatial outliers, where areas with high incidence were surrounded by low-incidence areas and vice versa.17,18 A first-order queen contiguity spatial weights matrix was applied to define neighbourhood structure for spatial autocorrelation analyses. Further, as crude district-level stillbirth rate (SBR) estimates may be unstable for a rare outcome due to small denominators, empirical Bayes (EB) smoothing19 was applied to district-level SBRs. Sensitivity analyses comparing spatial patterns derived from crude and smoothed rates are presented.

The study leveraged two strong statistical approaches to establish individual level risk factors. Risk factor assessment as exploratory assessments of correlates and prophylactically relevant markers rather than definitive causal determinants. Descriptive statistics were evaluated followed by bivariate logistic regression to present association between each risk factor and stillbirth. Later significant (P < 0.05) and biologically plausible variables were selected for the adjusted analyses. This was followed by a multivariable analysis in 3 different models. Multicollinearity between variables were assessed and variables exhibiting moderate co-variance (variance inflation factor [VIF] ≥ 2.5) (Appendix Table S5) were included within the final models. Results were presented using the standard template for presentation of descriptive, bivariate and multivariable analysis.20

Secondly, we executed propensity score matching (PSM) analysis amongst only significant modifiable exposure variables to appraise regression results findings (as it mimics randomized controlled trials by creating a matched dataset where treated and untreated groups have similar distributions of covariates). PSM is beneficial in scenarios with substantial covariate imbalance or rare outcomes, and is often used as a bounding analysis alongside regression models.21,22 Nearest neighbour matching is used. The reporting and interpretation for PSM is explained in detail in Appendix Table S6.

Ethical statement

We obtained certificate of exemption (COE) from the Ethics committee of IIHMR, New Delhi (COE number: IIHMR/ERC/ 2023 /10) as in full compliance with the international guidelines for Human Research protection. Data used in this study are de-identified and publicly available upon request through the Demographic and Health Surveys (DHS) Program website (https://dhsprogram.com), subject to registration and approval.

Role of the funding source

None.

Results

A total of 542,359 women who delivered in the five years preceding the three NFHS survey rounds (2005–06, 2015–16, and 2019–21) yielded stillbirth rates (SBR) of 12.8 (95% CI 10.7, 15.2), 16.2 (95% CI 13.6, 18.8), and 22.0 (95% CI 19.4, 24.7) per 1000 total births at more than equal to 28, more than equal to 24, and

Articles

more than equal to 20 weeks of gestation in India, respectively. Trend analysis revealed that the stillbirth rate during 2005–06 was 12.3 (95% CI 11.1, 13.5) per 1000 total births at more than equal to 28 weeks gestation, compared to 12.4 (95% CI 11.8, 13.0) and 13.8 (95% CI 13.0, 14.6) per 1000 in 2015–16 and 2019–21, respectively (Fig. 1; Appendix Table S7).

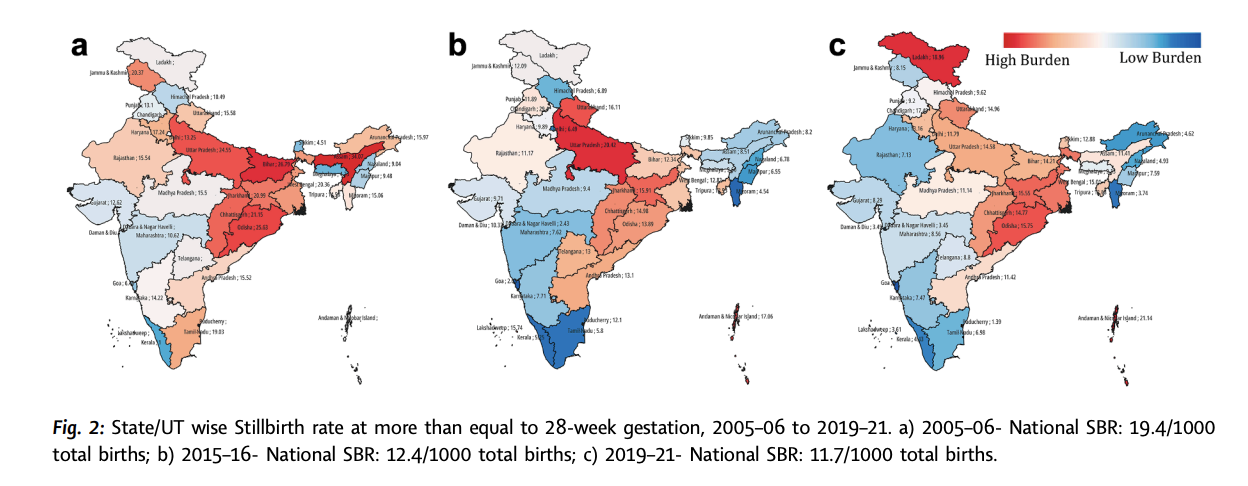
The relative reduction in stillbirths was highest (36.0%) between 2005–06 and 2015–16, while it declined modestly (8.4%) in the subsequent round (2015–16 to 2019–21). A similar pattern of decline was observed across all selected gestational age thresholds. Further a state/UT wise exploration of stillbirth burden at more than equal to 28 weeks gestation revealed that high stillbirth rate was reported mostly in larger states during 2005–06 (Fig. 2). During 2019–21 the high stillbirth rates were reported from states as depicted in Fig. 2; Appendix Table S8.

A state/UT wise burden for all the year is summarized in Appendix Table S8. During 2019–21, 19 out of 37 states/UTs (51.4%) reported a single-digit SBR, whereas 18 out of 37 (48.6%) and 0 out of 30 (0%) had SBR in single digit in 2015–16 and 2005–06 respectively. Details of states/UTs having SBR higher than national average are depicted in Appendix Table S9. Additionally, it was observed that approximately 40% (42.5% during 2019–21, 42.4% during 2015–16 and 41.2% during 2005–06) of all stillbirths in India are between 20 and 28 weeks of gestation. Moreover, state/UT wise assessment revealed that the contribution of SBR between more than equal to 20 weeks and less than equal to 28 weeks was higher than the national average in 38.9% (14/36), 45.7% (16/35), and 53.6% (15/28) of states during 2019–21, 2015–16 and 2005–06 respectively (Table 1).

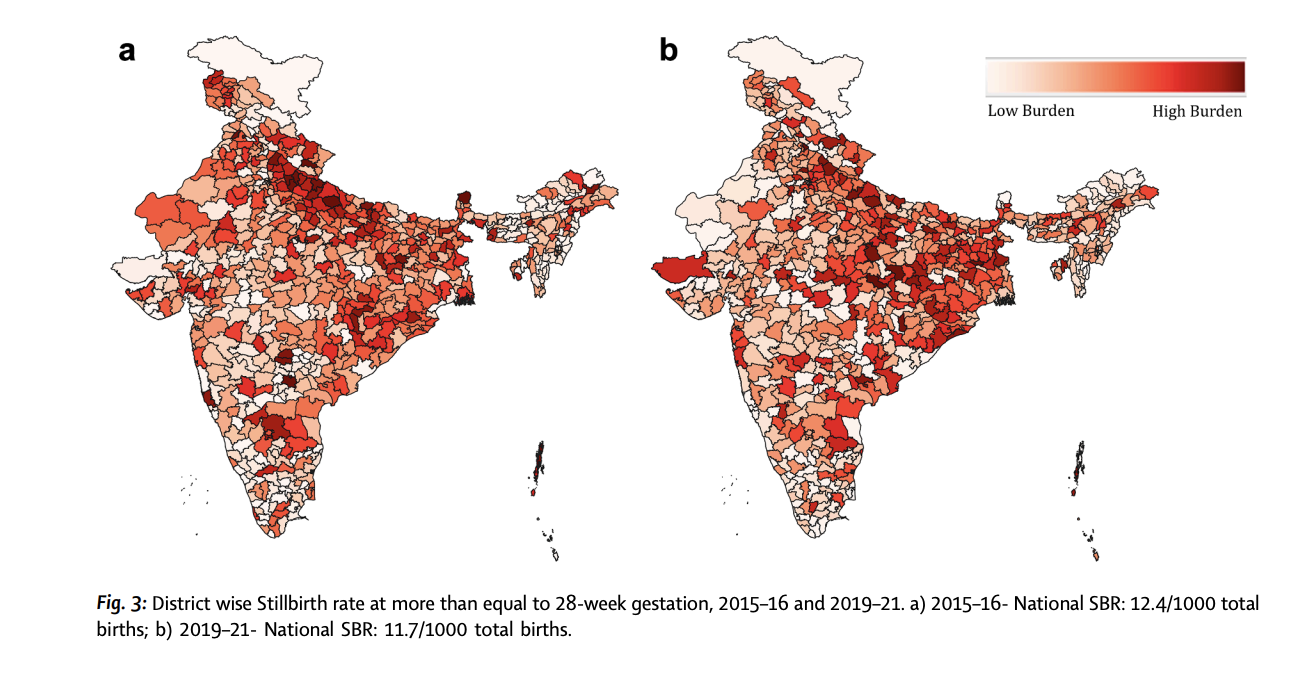
Analysis of SBR at the district level revealed clusters of value observed not only in states/UTs having value above the national average but also scattered across various parts of the country (Fig. 3). A detailed SBR by district is attached as Appendix Table S10. Analysis on district-wise SBR also revealed that 63.9% of the districts have SBR in single digit at more than equal to 28 weeks gestation, whereas only 23.6% are reportedly having SBR in single digit at more than equal to 20 weeks gestation (Table 2).

The distribution of stillbirths occurring between 20 weeks and 28 weeks of gestation showed a similar variance between 2015–16 and 2019–21. Overall, the data showed a modest increase in districts with higher proportions of early stillbirths over the study period (Appendix Table S11).

Further crude estimates of Moran's I indicated statistically significant clustering in approximately 119 districts during 2015–16 and 140 districts during 2019–21 whereas significant clustering was observed in approximately 114 and 115 districts using the smoothed rates during 2015–16 and 2019–21 respectively. The district level Global Moran's I for crude estimates are 0.225 and 0.134 whereas smoothed rates yielded a Global Moran's I of 0.219 and 0.168 respectively during 2015–16 and 2019–21, indicating a moderate positive spatial autocorrelation. This suggests that SBR in one district are influenced by and share similarities to those in adjacent districts (Appendix Table S12).

Bivariate analysis results revealed that the overall direction and relative patterns across socio-

Figure 1: Line Chart showing trend of stillbirth rate at equal to 28, 24, and 20 week gestation
Fig. 1: Trend of stillbirth rate at more than equal to 28-, 24- and 20-week gestation, 2005–06 to 2019–21. SBR at each gestational age is represented as a trend line in blue, red and dotted format for more than equal to 28-, 24- and 20-week gestation respectively.
Articles
Figure 2: Three Maps of India showing state/UT wise SBR at more than equal to 28-week gestation

demographic groups and geographies were consistent. Additionally, alternative gestational cutoffs sensitivity analyses yielded minimal, insignificant differences, indicating that the estimates are robust to minor shifts in gestational age classification.

Burden of stillbirth amongst women with various risk factors are summarised in Table 3. Results from multivariable analysis showed that women with high risk fertility behaviour, height less than equal to 145 cm, delivery at private facilities, and those using unclean fuels, residing in urban areas had higher odds of stillbirths (Table 3, Appendix Table S13). aOR of stillbirth at private facility was further assessed and findings revealed that this is often times disorientated to be effect modification by place of residence. The association between place of delivery and stillbirth is significant in rural areas but not in urban areas (Appendix Table S14).

Based on the findings of multivariable regressions, PSM of the selected modifiable variables from final multivariate models except early neonatal deaths were run for individual level risk factor assessment i.e. propensity score matching analysis. Quality of matching and table presenting verification of estimates of PSM are available in Appendix Table S15, Fig. S1, S2. The propensity score matching (PSM) analysis (Appendix Table S16) revealed notable differences in the effect of selected modifiable risk factors. The attenuation of these associations after covariate balancing suggests sensitivity to model specification and residual confounding, indicating that these relationships should be interpreted cautiously as associative rather than causal.

The average treatment effect (ATE) estimates indicate that several factors are associated with small changes in the probability of stillbirth. Exposure to high-risk fertility behaviour increased the probability of stillbirth by 0.0014, while the use of unclean cooking fuel increased it by 0.0041, and small family size by 0.0015. Illiteracy showed a relatively larger positive effect (0.0072), and residing in rural areas increased the probability by 0.0029. Private facility delivery and maternal anaemia was also associated with a higher probability (0.0025, 0.0020 respectively). In contrast desired pregnancies (−0.0032) were associated with a lower average probability of stillbirth. Overall, the estimated population-level effects are modest in magnitude but indicate differential associations across maternal and household characteristics (Appendix Table S16). Common support result showed >99% of the data were on support that were included in the analysis (Appendix Table S17).

Discussion

This study has estimated the trend of stillbirth rate at state level (2005 to 20 21) and 28 weeks gestation cutoff, and cross-sectional spatial distribution at the district level. We assessed a total of 542,359 women who delivered in the five years preceding the three survey rounds (2005–06, 2015–16, and 2019–21). The SBR has shown a decline post the 2005–06, although the trend from 2015-16 to 2019-21 has slowed down or reversed at some of the gestational age cut offs with 20–28 weeks consistently contributing to nearly 40% of stillbirths. This decline could be attributed to various national programs aimed at improving the availability, accessibility, affordability and utilisation of healthcare services. Study yielded stillbirth rates (SBR) of 12.8 (95% CI 10.7, 15.2), 16.2 (95% CI 13.6, 18.8), and 22.0 (95% CI 19.4, 24.7) per 1000 total births at more than equal to 28, 24, and 20 weeks of gestation in India, respectively. Additionally, the decline observed from 2005–06 to 2015–16 aligns with broader improvements in maternal and newborn care in India. However, the apparent plateau or rise in the most recent period should be interpreted cautiously. This pattern may partly reflect changes in reporting, recall dynamics, or survey implementation rather than a true epidemiologic reversal, especially given that NFHS-5 fieldwork overlapped with early pandemic-related disruptions. Moreover, other sources such as the Sample Registration System (SRS) generally report

Articles
Table 1: State/UT wise percentage of stillbirths between more than equal to 20 weeks and less than equal to 28 weeks of gestation, 2005–06 to 2019–21.
State/UT 2019–21 2015–16 2005–06
Jammu & Kashmir47.2%39.1%34.0%
Himachal Pradesh45.0%51.3%29.2%
Punjab53.4%39.5%44.8%
Chandigarh18.8%15.4%-
Uttarakhand45.5%38.9%-
Haryana51.5%44.3%30.5%
Delhi30.8%34.5%27.5%
Rajasthan49.2%45.1%48.1%
Uttar Pradesh48.1%43.2%40.3%
Bihar33.4%38.1%35.1%
Sikkim16.7%40.0%66.7%
Arunachal Pradesh51.4%29.4%35.7%
Nagaland38.1%31.8%33.3%
Manipur41.5%45.8%45.5%
Mizoram45.5%50.0%28.1%
Tripura30.0%44.4%38.6%
Meghalaya41.4%28.6%38.8%
Assam38.5%38.6%35.5%
West Bengal25.3%48.0%45.3%
Jharkhand43.3%37.9%38.8%
Odisha40.6%42.5%43.4%
Chhattisgarh35.5%40.3%40.9%
Madhya Pradesh44.8%40.6%40.0%
Gujarat54.5%49.3%52.6%
Dadra & Nagar Haveli16.7%60.0%-
Maharashtra51.3%57.3%50.9%
Andhra Pradesh44.0%49.6%62.8%
Karnataka46.2%52.6%50.4%
Goa50.0%0.0%53.3%
Lakshadweep0.0%33.3%-
Kerala55.6%16.0%81.3%
Tamil Nadu50.0%65.7%34.0%
Puducherry60.0%28.6%-
Andaman & Nicobar Island0.0%66.7%-
Telangana57.9%55.5%-
Ladakh42.9%--
India42.5%42.4%41.2%
Note: States/UT is marked as * do not have data. States with huge variation highlight small sample size. Ex: Goa, 0 stillbirths out of 8 reported in 2015-16 vs 1/2 in 2019-21. Overall proportions align with national averages.

(more than equal to 28 weeks). Our study findings further align with the findings from GBD estimates23 with burden reported as 12.8 in contrast to 17.4 at more than equal to 28 gestational age. This study findings also align with the analysis by Purbey-colleagues,24 that reported stillbirth burdens of 12.3, 12.4, and 13.8/1000 total births during 2005–06, 2015–16, and 2019–21, respectively. However, their study did not use gestational age cutoffs, a 3rd robust point on NFHS data to provide state- and district-level estimates. While the findings are largely consistent, it is important to note the suboptimal reporting within the HMIS data system.25 N. Nungari’s and colleagues26 have relied on data from the Civil Registration System (CRS), reported a SBR of 6.3 per 1000 total births. This raises a critical question about the reliability of such data sources for policy decision-making, as the CRS data may systematically underestimate the burden by nearly half. Moreover, these estimates do not provide the gestational age wise estimates. By capturing the stillbirth burden, The data from HMIS and CRS comes with limitations due to lack of reporting, and varied interpretation of term cases.

This study reported that approximately 40% of total stillbirths occur between more than equal to 20 weeks and less than equal to 28 weeks of gestation, implying that focusing solely on global estimates restricted to more than equal to 28 weeks of gestation (in line with global recommendations) could miss up to 40% of the true stillbirths are being excluded. Smith and colleagues27 reported that 30% of total stillbirths occur between more than equal to 22 weeks and <28 weeks of gestation, matching our overall findings when comparing the burden. Thus, utilizing the lower cut-off allows for tracking stillbirth at an earlier age point, an essential measure in context to Indian scenario, since a proportion of cases may occur before the recommended 28 weeks of gestation (allows for international comparisons and facilitates tracking progress towards ENAP and INAP 2030 target.28 However, it is equally essential to have estimates that straddle early weeks to capture true incidence and a more comprehensive understanding of the overall burden, thereby supporting more focused interventions.

The study highlights progress from only 20% of states/UTs reporting single-digit SBR in 2005–06 to 51% achieving this milestone in the most recent period. While this indicates substantial improvement in overall SBR reduction, disparities persist-approximately 12.2% of districts continue to report an SBR of more than 20/1000 births, and 35.0% of districts report an SBR (more than equal to 28 weeks gestation) between 10 and 20/1000 births. Further it is interesting to note that these districts are not clustered in one region rather scattered across multiple regions. This underscores the need to respond to the local context, identifying specific challenges, and designing targeted interventions at facility and community to reduce stillbirths. Studies suggest that community-based interventions alone are

Articles
Figure 3: Two Maps of India showing district wise SBR at more than equal to 28-week gestation

unlikely to have significant effect on SBR without strengthening quality of facility-based intervention irrespective of the SBR. The effectiveness of community level interventions depends on various factors like acceptability of intervention in community, community readiness etc.29 Purbey and colleagues24 reported that burden by districts in northern, eastern and central India states, similar to our observation. These could largely be due to social determinants (poverty, low education, malnutrition) combined with limited access and poor utilization of healthcare services as these states which fall within the category of EAG i.e., Empowered Action Group.30

The quality and availability of data on stillbirth remains suboptimal, highlighting the need for high-quality, granular, and standardized data systems with consistent and accurate reporting of gestational age.5,31 Such improvements are essential for global comparisons. Further the data must be made more accessible and actionable for evidence-based decision-making at district/state level.

Though NFHS is valuable for describing patterns and associations, and many of the findings from risk factor assessment are plausible and consistent with the wider literature, temporality and residual confounding remain central constraints. Risk factor assessment

Table 2: Proportion of districts reporting a single-digit stillbirth rate (SBR) and those reporting an SBR exceeding 20 per 1000 total births in India, 2015-16 to 2019-21.
Numbers of districts 2015-16
n (%)
2019-21
n (%)
(More than equal to 20 weeks)
SBR more than 20/1000 total births [n (%)] 56 8.0% 86 12.2%
SBR between 10 and 20/1000 total births [n (%)] 259 40.5% 254 35.9%
SBR in single digit [n (%)] 384 54.4% 367 51.9%
(More than equal to 24 weeks)
SBR more than 20/1000 total births [n (%)] 148 23.1% 137 19.4%
SBR between 10 and 20/1000 total births [n (%)] 280 43.8% 315 44.6%
SBR in single digit [n (%)] 279 39.5% 255 36.1%
(More than equal to 28 weeks)
SBR more than 20/1000 total births [n (%)] 278 43.4% 296 41.9%
SBR between 10 and 20/1000 total births [n (%)] 258 40.3% 275 38.9%
SBR in single digit [n (%)] 104 16.3% 136 19.2%
Articles
Table 3: Characteristics distribution and risk factors for stillbirth at more than equal to 20-week gestation (weighted), 2019-21.
Variables Categories Weighted
Sample (N)
N = 176,219
Live birth Stillbirth Stillbirth/1000
total births
Unadjusted odds
ratio (OR)
Maternal characteristics
High risk fertility behaviour No 6,289 6,289 36 5.8 Ref
Yes 1,67,783 1,66,340 1443 8.6 1.56 (1.06, 2.29)
Education of women Educated 1,30,056 1,28,945 1111 7.7 Ref
Illiterate 46,163 45,695 468 10.3 1.25 (1.11, 1.40)
Age at first birth 15–34 1,69,215 1,67,801 1414 8.4 Ref
<15 & >=35 3664 3623 41 11.2 1.34 (1.00, 1.80)
Height of women (in cm) More than 145 55,516 55,185 305 6.0 Ref
Less than equal to 145 1,15,553 1,14,378 1175 9.6 1.75 (1.52, 2.01)
Tobacco use No 1,68,557 1,67,102 1455 8.5 Ref
Yes 4327 4298 29 6.6 0.75 (0.58, 0.96)
Wanted baby (when pregnant) Then 1,60,214 1,58,787 1427 8.9 Ref
Later or no more 13,538 13,452 86 6.2 0.79 (0.64, 0.98)
Drink alcohol No 1,74,228 1,72,763 1465 8.4 Ref
Yes 957 952 5 5.3 0.55 (0.31, 0.97)
Maternal anaemia Yes 1,21,162 1,20,210 952 7.8 Ref
No 49,617 49,122 495 10.0 1.33 (1.19, 1.49)
Timing of ANC First trimester 1,12,886 1,11,879 1007 8.7 Ref
2nd/3rd trimester 50,225 49,759 467 9.3 1.11 (0.99, 1.24)
Number of ANC More than equal to 4 1,03,061 1,02,306 755 7.3 Ref
Less than 4 62,940 62,247 692 11.0 1.52 (1.38, 1.67)
Articles
Variables Categories Weighted
Sample (N)
N = 176,219
Live birth Stillbirth Stillbirth/1000
total births
Unadjusted odds
ratio (OR)
(Continued from previous page)
Household characteristics
Floor material Clean 1,11,990 1,11,184 805 7.2 Ref
Unclean 62,234 61,560 674 10.8 1.55 (1.39, 1.73)
Religion Hindu 1,38,540 1,37,337 1203 8.2 Ref
Muslim/Others 35,768 35,465 303 7.8 0.94 (0.83, 1.08)
Place of residence Urban 49,122 48,802 320 6.5 Ref
Rural 1,24,187 1,23,027 1159 9.3 1.44 (1.26, 1.63)
Community wealth status High 1,49,615 1,48,416 1199 8.0 Ref
Low 24,694 24,414 280 11.4 1.45 (1.26, 1.66)
Community characteristics
Community education status Non-poor 1,35,716 1,34,606 1110 8.2 Ref
Poor 37,879 37,510 368 9.7 1.16 (1.03, 1.30)
Region Northern 22,320 22,143 176 7.9 Ref
Central 41,832 41,296 535 10.8 1.55 (1.26, 1.91)
North-eastern 11,452 11,363 88 7.7 1.10 (0.84, 1.44)
Eastern 44,601 44,420 181 11.3 2.70 (2.08, 3.51)
Western 33,522 33,329 193 5.8 1.08 (0.86, 1.37)
Table 3: Characteristics distribution and risk factors for stillbirth at more than equal to 20-week gestation (weighted), 2019-21.

revealed High risk fertility behaviour (HRFB), illiteracy, delivering at private healthcare facility, using unclean fuel for cooking, residing in rural area and belonging to scheduled caste as risk factors. High rate at private facility appears to be effect modification by place of residence. The association between type of facility and stillbirths is significant in rural areas but not in urban areas. This suggests that in rural settings, private facility deliveries are associated with higher odds of stillbirth compared to public facilities, whereas in urban areas, the difference is not statistically significant. Further deliberation on this finding should consider possible referral patterns, selection differences, and access-related factors. Residing in joint family emerged as protective factor and High risk fertility behaviour (HRFB)32,33 emerges as a significant risk factor implying the importance of age, birth spacing, and parity in adverse outcomes. However, after matching the dataset the SBR turned non-significant except. The link between healthcare readiness and the effect may be confounded by underlying socioeconomic and health related factors. Illiteracy also emerged as other social determinant, which could be due to overall poor health literacy during pregnancy and intrapartum period.34,35 These findings are in line with other published literature14,36-38 showing the central role of education in empowering women to recognize danger sign and seek timely care at appropriate healthcare facility. Biological factors like short maternal stature (<145 cm) and maternal anaemia emerged as factors influencing stillbirth. Short maternal stature reaffirm the intergenerational nature of risk of stillbirth and other associated adverse outcomes.24,39,40 India carries a high burden of maternal anaemia with almost half of the pregnant women affected.10 Compliance to iron supplementation has remained as one of the biggest challenges to address this deficiency effectively.41,42

Similar to our study existing evidence also report that use of unclean fuel like agricultural waste, cow dung, etc could increase the risk to adverse outcomes like stillbirth.43 This is in reference to pollutants like carbon monoxide, particulate matter etc. that can impair placental function, leading to foetal hypoxia. Interestingly in line with existing literature this study observed that women residing in a joint family (more than equal to 5 members) had significantly lower risk of stillbirth.44 It is plausible that women in nuclear families and other limited household in the importance of monitoring foetal movements during the late gestations periods translated into negative that a lack of awareness regarding decreased foetal movement is one of the most single factors women face their experiences stillbirths.45 The protective associations observed for joint family structure and delayed pregnancy are particularly noteworthy in the Indian context, where family systems may influence social support, resource pooling, health-seeking behaviour, and buffering during obstetric complications. While exploratory, these findings warrant careful discussion and is indicative of a hypothesis for future research on the social ecology of stillbirth risk.

Place of residence, regional and caste-based inequalities were also evident in our study. Studies emphasize the importance of region-specific strategies to address localized risk factors. Such approaches can bridge gaps in care and ensure equitable access to

Articles

essential healthcare services.46,47 Higher risk reported from private healthcare deliveries reflects a possible referral bias or differences in case-complexity.38,48,49 Our study noted that there are associations with anaemia, short stature, unclean fuel, rural residence, and caste. These variables also represent a plausible marker of deprivation and structural disadvantage. Thus, social and household characteristics may operate through unmeasured clinical pathways (e.g., undiagnosed/uncontrolled gestational diabetes, maternal infections, or foetal growth restriction, which are not adequately captured in NFHS). Acknowledging these intermediate pathways will help prevent overinterpretation of these correlates as direct biological effects while retaining their programmatic relevance as markers of vulnerability.

This study has provided insights on the burden of stillbirth at different gestational age cutoffs at national, district and state level. Additionally, it demonstrates the proportion of uncounted foetal death that occurring late gestational age stillbirths. The use multi-pronged approach is another key strength of this study. For the burden assessment, study relied on quantifying the clustering of stillbirth burden using methods like Moran’s I. To address the issue of variance in empirical district-level SBR estimation for a relatively rare outcome, the sensitivity spatial analysis depending on EB results is presented. Further for risk stratification, the study did not rely solely on regression models, which provided a foundation for risk factor assessment by also reporting the potential confounders while examining relationship between exposure and outcome. Further, another strength of the study is use of another robust methods like PSM which mimic randomized controlled trial conditions by balancing observed covariates between exposed and unexposed groups.

While there are many strengths to the study, there exist certain limitations. Existing literatures raised questions on the data quality within India when compared between different reporting systems be it a routine or survey dataset. Owing to this limitation, there exist uncounted stillbirths and unclassified live stillbirth. This reclassification may have introduced minor misclassification, as months were aggregated from weeks (e.g., a late-week pregnancy or early-week delivery counted as a full month); however, this is expected to be minimal and overall observations are noted as a limitation. Sensitivity analyses demonstrated robustness to alternative gestational cutoffs, month-level aggregation (from weeks) may have introduced minor misclassification, particularly around boundary values due to rounding and heaping. Additionally, the calendar category "termination" may include induced abortions and miscarriages; while late-trimester abortions constitute a very small proportion in India, some residual misclassification between foetal deaths and pregnancy terminations cannot be entirely excluded. NFHS does not allow distinction between antepartum and intrapartum stillbirths, nor precise differentiation from very early neonatal deaths, potentially affecting outcome specificity. Recall bias in retrospective calendar histories and possible under-reporting of induced abortions due to stigma may have influenced estimates. The absence of detailed clinical covariates (e.g., hypertensive disorders, infections, foetal growth restriction) limits adjustment for biological pathways and residual confounding is likely. Unmeasured state-level factors (e.g. healthcare infrastructure, policy implementation) and district-level compositional factors may have unmeasured impacts on cluster formations. Though spatial harmonisation was undertaken to ensure comparability. Given this cross-sectional and observational design, findings should be interpreted as associative rather than causal. Future studies linking survey findings with prospective clinical data and explicit causal modelling frameworks (e.g., directed acyclic graphs) are needed to better untangle pathways and draw stronger causal inference.

In short, while the study highlights the counting only global recommendations would overlook a substantial burden of missing approximately 40% of total stillbirth burden. The study further reiterates that stillbirth is an important public health concern, with notable spatial and socio-demographic disparities in India. Despite progress, the persistently high stillbirth rates, particularly at earlier gestational ages underscore the need for strengthened maternal and newborn care. District-level clustering suggests concentrated areas of vulnerability requiring targeted interventions. Addressing preventable risk factors through comprehensive maternal and newborn care strategies is also critical for reducing the burden. The study calls for improved data systems with accurate gestational age reporting for evidence-based decision-making at district/state level.

Contributors
Conceptualization: AKP, DAW. Data curation: AKP. Formal analysis: AKP. Methodology: AKP, DAW, SBN. Supervision: DAW, SBN. Validation: AKP, BS, SP. Visualization: AKP, BS, SP. Writing - original draft: AKP, BS, SP. Writing - review & editing: AKP, DAW, SBN, BS, SP.

Data sharing statement
Data used in this study are de-identified and publicly available upon request through the Demographic and Health Surveys (DHS) Program website (https://dhsprogram.com), subject to registration and approval.

Declaration of interests
Authors declare no competing interests.
Articles
Acknowledgements
The authors would like to acknowledge Dr. Diksha Gautam from IIHMR Delhi and Dr. Raman Sharma, from IIHMR Delhi for their support in helping for validation the results.

Appendix A. Supplementary data
Supplementary data related to this article can be found at https://doi.org/10.1016/j.lansea.2024.100757.

References
  1. WHO. Indicator metadata registry details [cited 2023 Dec 15]. Available from: https://www.who.int/data/gho/indicator-metadata-registry/imr-details/3300
  2. UNICEF. Stillbirths [cited 2023 Dec 15]. Available from: https://data.unicef.org/topic/maternal-health/stillbirths/
  3. Pandey AK, Neogi SB, Gautam D, et al. “Silent Losses Silent Data”: reviewing stillbirth data quality in low- and middle-income countries. Glob Rep. 2023;10.1186/s41256-023-00330-z.
  4. Blencowe H, Cousens S, Jassir FB, et al. National, regional, and worldwide estimates of stillbirth rates in 2015, with trends from 2000: a systematic analysis. Lancet Glob Health. 2016;4(2):e98–108.
  5. Lawn JE, Blencowe H, Waiswa P, et al. Stillbirths: rates, risk factors, and acceleration towards 2030. Lancet. 2016;387(10018):587–603.
  6. India Newborn Action Plan (INAP). Ministry of Health and Family Welfare, Government of India; 2014.
  7. Health Management Information System (HMIS) | Ministry of Health and Family Welfare. [cited 2023 Dec 15]. Available from: https://hmis.mohfw.gov.in/
  8. Office of the Registrar General & Census Commissioner, India. Sample Registration System (SRS) Bulletins. [cited 2023 Dec 15].
  9. IIPS & ICF. National Family Health Survey (NFHS-5), 2019-21: India. Mumbai: International Institute for Population Sciences; 2021.
  10. The DHS Program. Available from: https://dhsprogram.com/
  11. Commission on Social Determinants of Health. Closing the gap in a generation: health equity through action on the social determinants of health. WHO; 2008.
  12. Solar O, Irwin A. A conceptual framework for action on the social determinants of health. WHO; 2010.
  13. Bhutta ZA, Das JK, Bahl R, et al. Can available interventions end preventable deaths in mothers, newborn babies, and stillbirths, and at what cost? Lancet. 2014;384(9939):347–370.
  14. Rubin DB. Multiple Imputation for Nonresponse in Surveys. John Wiley & Sons; 2004.
  15. Anselin L, Syabri I, Kho Y. GeoDa: An Introduction to Spatial Data Analysis. Geogr Anal. 2006;38(1):5–22.
  16. Anselin L. Local Indicators of Spatial Association—LISA. Geogr Anal. 1995;27(2):93–115.
  17. Ord JK, Getis A. Local Spatial Autocorrelation Statistics: Distributional Issues and an Application. Geogr Anal. 1995;27(4):286–306.
  18. Marshall RJ. Mapping disease and mortality rates using Empirical Bayes Estimators. Appl Stat. 1991;40(2):283–294.
  19. Vandenbroucke JP, von Elm E, Altman DG, et al. Strengthening the Reporting of Observational Studies in Epidemiology (STROBE): Explanation and Elaboration. PLoS Med. 2007;4(10):e297.
  20. Rosenbaum PR, Rubin DB. The central role of the propensity score in observational studies for causal effects. Biometrika. 1983;70(1):41–55.
  21. Austin PC. An Introduction to Propensity Score Methods for Reducing the Effects of Confounding in Observational Studies. Multivariate Behav Res. 2011;46(3):399–424.
  22. GBD 2019 Demographics Collaborators. Global age-sex-specific fertility, mortality, healthy life expectancy (HALE), and population estimates in 204 countries and territories, 1950–2019. Lancet. 2020;396(10258):1160–1203.
  23. Purbey M, Yadav S, Mohanty SK. State and district level estimates and covariates of stillbirth in India, 2015-16 to 2019-21. PLoS One. 2023;18(9):e0291414.
  24. HMIS data validity and reliability issues. Ministry of Health and Family Welfare.
  25. Nungari N, et al. Assessment of Civil Registration System (CRS) data for stillbirth estimates. J Public Health. 2022.
  26. Smith GCS, Fretts RC. Stillbirth. Lancet. 2007;370(9600):1715–1725.
  27. WHO. Every Newborn: an action plan to end preventable deaths. Geneva: World Health Organization; 2014.
  28. Lassi ZS, Bhutta ZA. Community-based intervention packages for reducing maternal and neonatal morbidity and mortality and improving neonatal outcomes. Cochrane Database Syst Rev. 2015;(3):CD007754.
  29. MoHFW. Empowered Action Group (EAG) States.
  30. McClure EM, Saleem S, Goudar SS, et al. Stillbirth rates in low-middle income countries 2010 - 2013: a population-based, multi-country study from the Global Network. Reprod Health. 2015;12(S2):S7.
  31. Conde-Agudelo A, Rosas-Bermudez A, Kafury-Goeta AC. Birth spacing and risk of adverse perinatal outcomes: a meta-analysis. JAMA. 2006;295(15):1809–1823.
  32. Rutstein SO. Effects of preceding birth intervals on neonatal, infant and under-five mortality and nutritional status in developing countries: evidence from the demographic and health surveys. Int J Gynaecol Obstet. 2005;89(S1):S7–S24.
  33. Karlsen S, Say L, Souza JP, et al. The relationship between maternal education and mortality among women giving birth in health care institutions: Analysis of the cross sectional WHO Global Survey on Maternal and Perinatal Health. BMC Public Health. 2011;11(1):606.
  34. Desai S, Alva S. Maternal education and child health: Is there a strong causal relationship? Demography. 1998;35(1):71–81.
  35. Garg R, Deighton S, Uxa R, et al. Educational disparities in perinatal mortality: a systematic review and meta-analysis. BMJ Open. 2021;11(3):e043132.
  36. Bhalotra S, Clarke D. Educational Attainment and Maternal Mortality. J Hum Cap. 2013.
  37. Vogel JP, Lee ACC, Souza JP. Maternal morbidity and perinatal outcomes: a WHO multicountry facility-based analysis. BJOG. 2014.
  38. Kozuki N, Katz J, Christian P, et al. The associations of birth intervals with small-for-gestational-age, preterm, and neonatal and infant mortality: a meta-analysis. BMC Public Health. 2013;13(3):S3.
  39. World Health Organization. Comprehensive implementation plan on maternal, infant and young child nutrition. 2014.
  40. Stevens GA, Finucane MM, De-Regil LM, et al. Global, regional, and national trends in haemoglobin concentration and prevalence of total and severe anaemia in children and pregnant and non-pregnant women for 1995-2011: a systematic analysis of population-representative data. Lancet Glob Health. 2013;1(1):e16–e25.
  41. Ganchimeg T, Ota E, Morisaki N, et al. Pregnancy and childbirth outcomes among adolescent mothers: a World Health Organization multicountry study. BJOG. 2014;121:40–48.
  42. Amegah AK, Quansah R, Jaakkola JJ. Household air pollution, nutritional status and housing conditions as joint predictors of adverse pregnancy outcomes. Environ Res. 2014;134:255–261.
  43. Pallikadavath S, Foss M, Stones RW. Antenatal care: provision and inequality in rural north India. Soc Sci Med. 2004;59(6):1147–1158.
  44. Froen JF, Pinar H, Flenady V, et al. Causes of death and associated conditions (Codac): a utilitarian approach to the classification of perinatal deaths. BMC Pregnancy Childbirth. 2009;9(1):22.
  45. Marmot M. Social determinants of health inequalities. Lancet. 2005;365(9464):1099–1104.
  46. Victora CG, Requejo JH, Barros AJ, et al. Countdown to 2015: a decade of tracking progress for maternal, newborn, and child survival. Lancet. 2016;387(10032):2049–2059.
  47. Singh K, Brodish P, Speizer I. Local geospatial and contextual factors associated with facility delivery in India. Int J Qual Health Care. 2014;26(4):435–442.
  48. Randive B, Diwan V, De Costa A. India's Conditional Cash Transfer Programme (the JSY) to Promote Institutional Birth: Is There an Association between Institutional Birth Proportion and Maternal Mortality? PLoS One. 2013;8(6):e67452.